
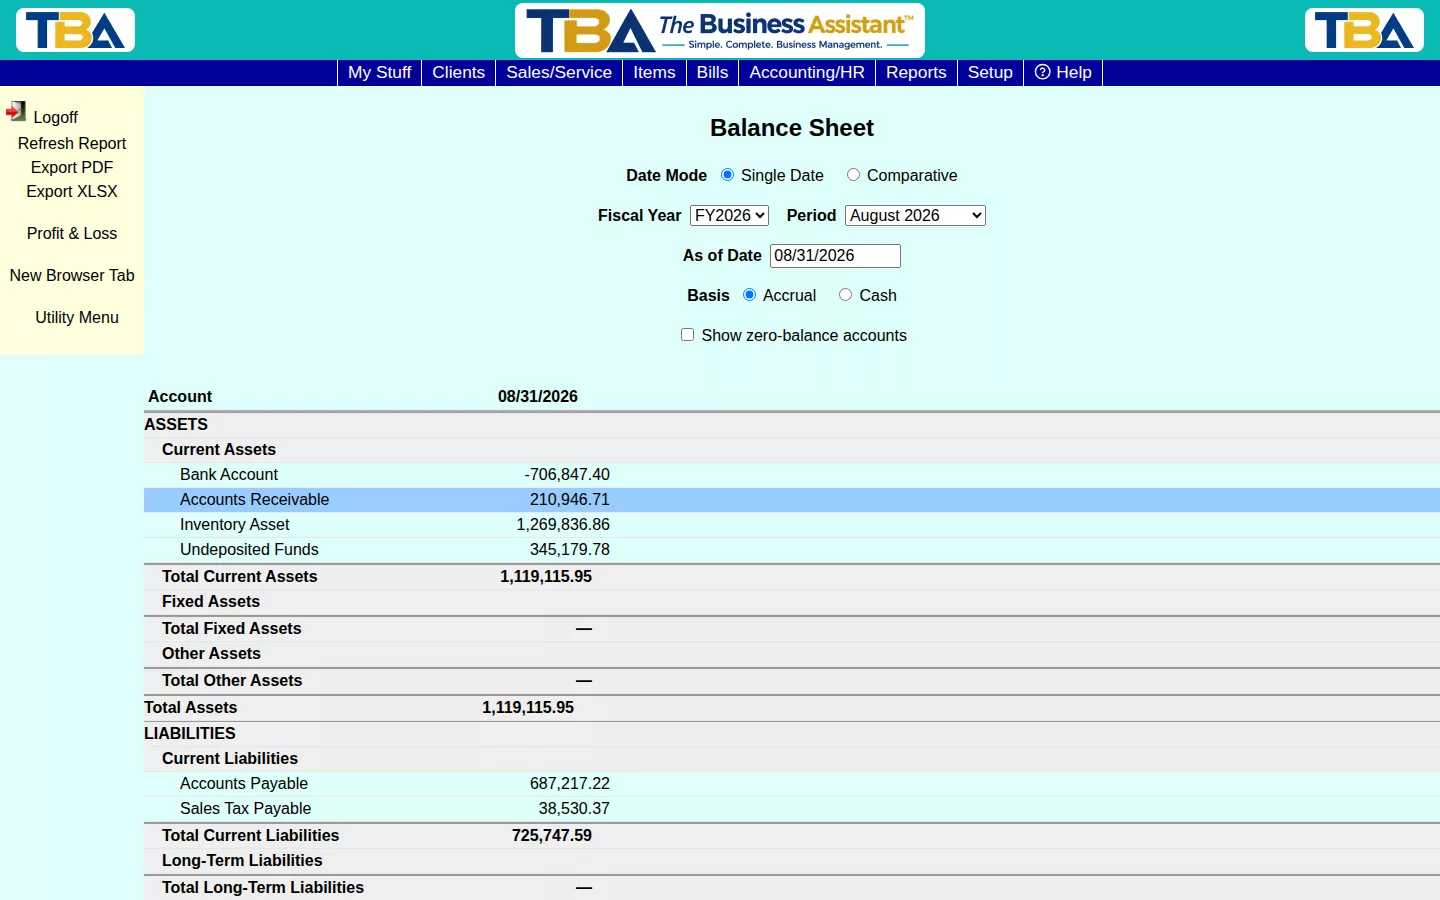
The Balance Sheet shows what your company owns, owes, and is worth as of a specific date — Assets, Liabilities, and Equity.
Options #
Choose Single Date or Comparative (side-by-side periods), pick a Fiscal Year/Period or a custom As of Date, and Accrual or Cash basis. Show zero-balance accounts includes accounts with nothing posted. Jump to Profit & Loss from the sidebar to see the other half of the picture.
The Options #
- Date Mode — Single Date shows one column. Comparative adds a second date; if you leave it blank, TBA compares to one year earlier.
- Fiscal Year and Period — pick the end of a period, or type any As of Date.
- Basis — Accrual (income when invoiced, expenses when billed) or Cash (when the money moves).
- Site — All Sites, Single Site, or Custom (tick the sites to include). See Sites Setup.
- Show zero-balance accounts.
Reading It #
Assets must equal Liabilities plus Equity. Equity includes your current-year net income, even before you close the year. Your own wording for accounts comes from the chart of accounts.
Drilling Down #
Click an account to see the General Ledger activity behind it, from the start of the fiscal year to the as-of date. Export PDF and Export XLSX save a copy. The sidebar also jumps to Profit & Loss.


