
The Financial Dashboard shows your company’s main financial numbers as charts on one page. Every figure comes from the same data as the financial reports, so the dashboard always agrees with them. Find it under Reports > Financial Reports > Financial Dashboard. You need permission to view financial reports.
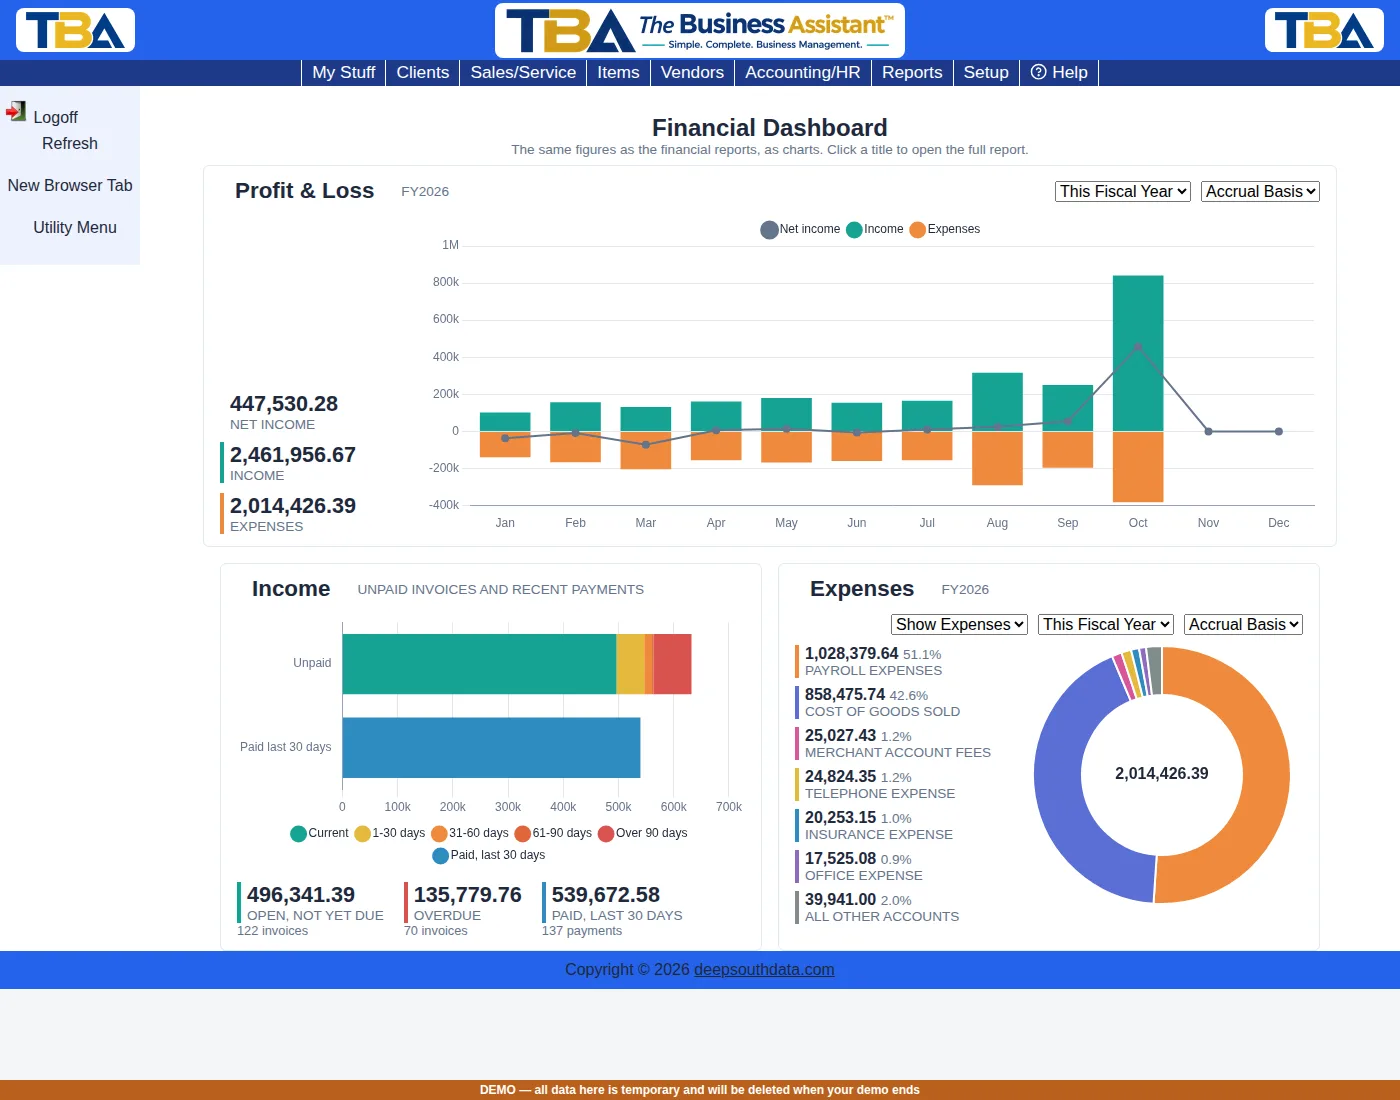
Click a tile’s title, or click its chart, to open the full report behind it. Hover over any bar, slice or point to see its exact amount.
Your Settings Are Remembered #
Every selection on this page (the Site, and each tile’s period, basis and view) is saved for your login. The next time you open the dashboard, it looks the way you left it, on any computer. Other users keep their own settings.
Site #
If your company has more than one site, a Site list appears at the top. Choose a site to limit the Profit & Loss, Income and Expenses tiles to it, or leave it on all sites. The Bills view is not affected by the Site list, because bills are not assigned to a site.
Profit & Loss #
A bar for each month’s income and expenses, with a line showing net income. The totals beside the chart are Net income, Income and Expenses for the period. Hover over a month to see its income, expenses and profit percentage.
- Period — This Fiscal Year, Last Fiscal Year, or Last 12 Months.
- Basis — Accrual counts income when invoiced and expenses when billed; Cash counts them when money is received or paid. See Profit and Loss.
Income #
One bar shows your unpaid invoices by age, in the same colors as AR Aging (Current, 1-30, 31-60, 61-90 and Over 90 days). A second bar shows what you were paid in the last 30 days. The totals underneath are:
- Open, not yet due — unpaid invoices that are not yet past due, with the number of invoices.
- Overdue — unpaid invoices past their due date, with the number of invoices.
- Paid, last 30 days — client payments received in the last 30 days, with the number of payments.
Expenses and Bills #
The Expenses tile has a list at the top right to switch between Show Expenses and Show Bills.
Show Expenses #
A doughnut chart of your six largest expense accounts for the period, with everything else grouped as All other accounts. The total is in the center, and the legend lists each account’s amount and its share of the total. Choose the Period (This Fiscal Year, Last Fiscal Year or Last 12 Months) and the Basis (Accrual or Cash). The total equals Total Expenses on the Profit and Loss report.
Show Bills #
Shows the bills you still owe, as of today, so you can see what you need to pay and when. The Period and Basis lists are hidden in this view, since they do not apply.
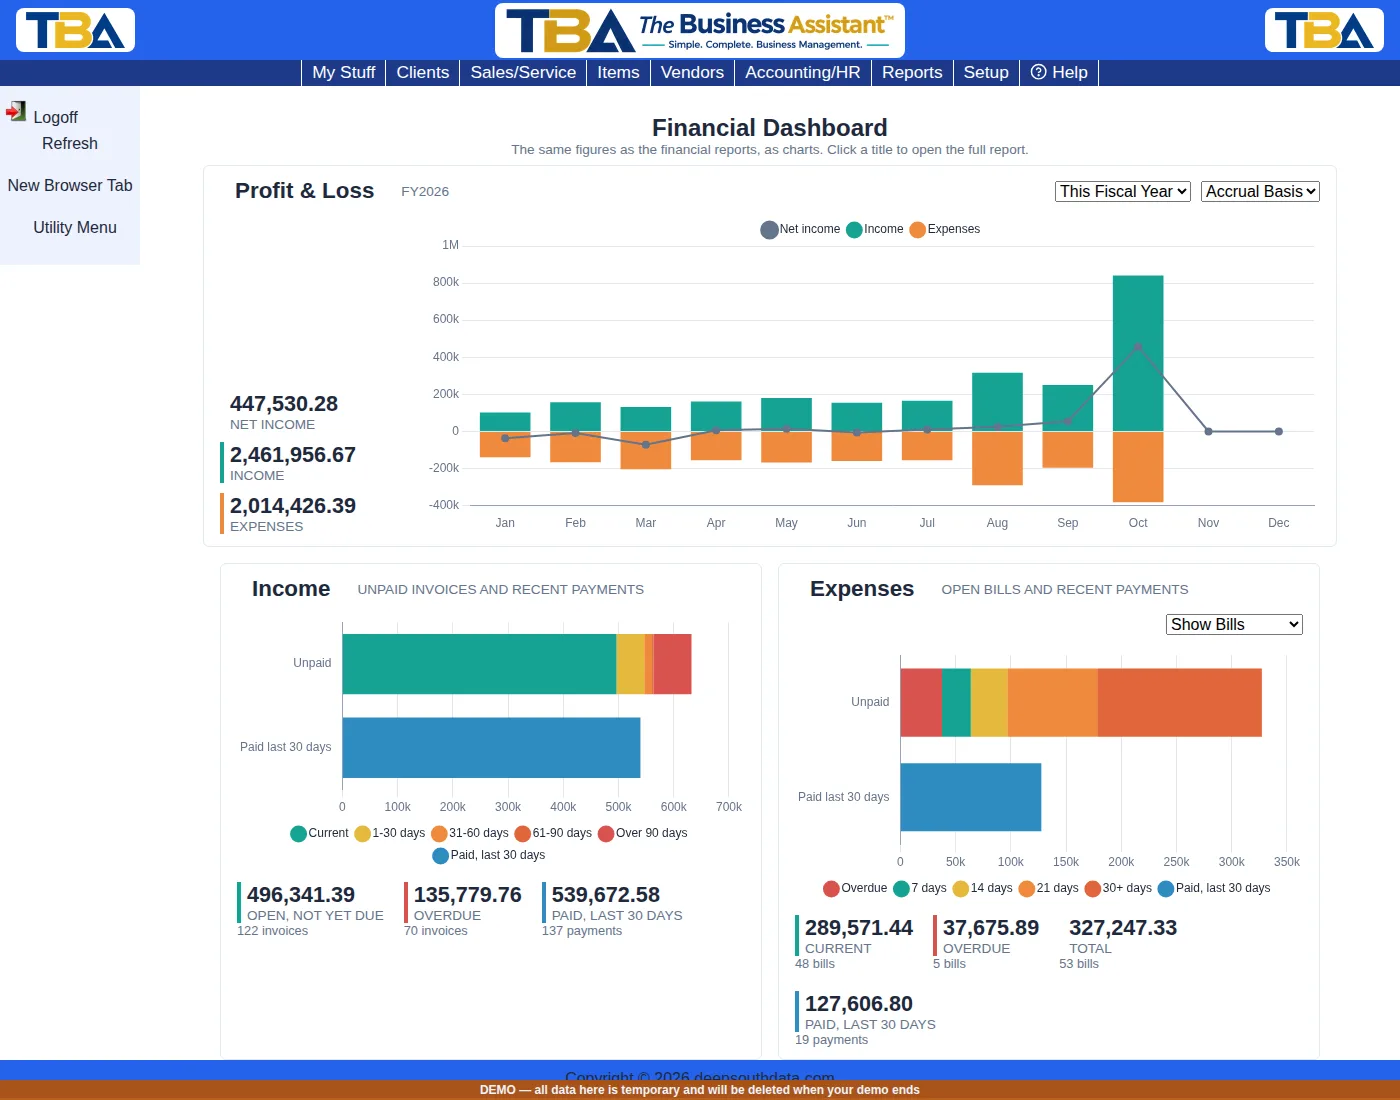
- Unpaid bar — your open bills, split into Overdue (red), 7 days, 14 days, 21 days and 30+ days. Each bill appears in only one segment, by how soon it is due. A bill with no due date is counted in 30+ days.
- Hover totals are cumulative. Hover over 14 days and the tip reads “Due 0-14 days” and shows everything due within 14 days, including the 7-day segment and the overdue bills (they are still due). The 21-day tip is “Due 0-21 days”, and the 30+ tip, “Due 0-30+ days”, is the total of all your open bills. The Overdue segment shows only the overdue amount.
- Paid last 30 days bar — bill payments made in the last 30 days (voided payments are left out).
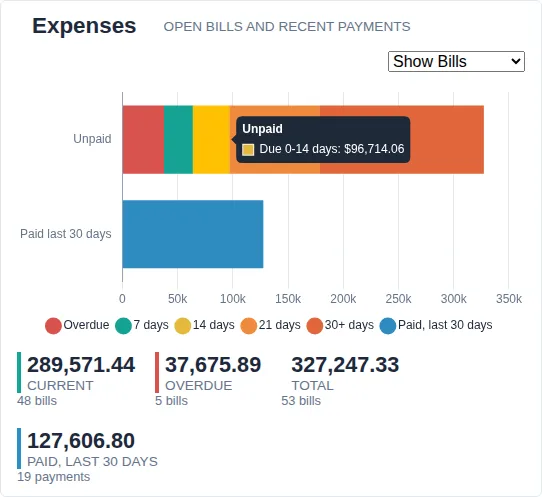
The totals underneath are:
- Current — open bills that are not yet due. It does not include overdue bills.
- Overdue — open bills past their due date.
- Total — all open bills (Current plus Overdue), with the number of bills.
- Paid, last 30 days — bill payments made in the last 30 days, with the number of payments.
Open bills are those with a balance still owing (status Open or Partial payment). A vendor credit reduces the amount in the segment it falls in, the same way it does on AP Aging. Click the chart to open AP Aging.


